| # | Cities | Reg | Population Residents | Surface km2 | Density inhabitants/km2 | Altitude m a.s.l. | % RD % |
|---|---|---|---|---|---|---|---|
| 1 | Milan | LOM | 1.366.180,00 | 181,67 | 7 589 | 122 | 65,52% |
| 2 | Venice | VEN | 262.321,00 | 415,9 | 626 | 2 | 65,17% |
| 3 | Padua | VEN | 210.912,00 | 93,03 | 2.267 | 12 | 61,28% |
| 4 | Bologna | EMR | 389.261,00 | 140,86 | 2.773 | 54 | 57,24% |
| 5 | Verona | VEN | 257.275,00 | 198,92 | 1.297 | 59 | 54,49% |
| 6 | Florence | TOS | 380.948,00 | 102,32 | 3.703 | 50 | 53,49% |
| 7 | Turin | PIE | 875.698,00 | 130,01 | 6.736 | 239 | 53,54% |
| 8 | Messina | SIC | 235.012,00 | 213,75 | 1.088 | 3 | 53,47% |
| 9 | Rome | LAZ | 2.856.133,00 | 1.287,36 | 2.219 | 20 | 44,98% |
| 10 | Trieste | FVG | 204.267,00 | 85,11 | 2.400 | 2 | 41,69% |
| 11 | Genoa | LIG | 580.097,00 | 240,29 | 2.405 | 19 | 39,92% |
| 12 | Bari | PUG | 323.370,00 | 117,39 | 2.733 | 5 | 38,35% |
| 13 | Naples | CAM | 966.144,00 | 119,02 | 8.059 | 17 | 37,50% |
| 14 | Palermo | SIC | 668.405,00 | 160,59 | 4.131 | 14 | 13,60% |
| 15 | Catania | SIC | 311.620,00 | 182,9 | 1.704 | 7 | 11,29% |
From June 2022 (RD figure: 52.69%) to May 2023 (RD figure: 57.02%) the increase in separate waste collection was 4.33%
Waste Data
| Years | 2018 | 2019 | 2020 | 2021 | 2022 | |
|---|---|---|---|---|---|---|
| Production Total | Kg. | 120.189.457 | 111.860.309 | 101.878.379 | 97.952.126 | 99.853.889 |
| Collection Diff. Packaging | Kg. | 7.322.056 | 10.004.516 | 15.985.820 | 24.099.067 | 24.550.888 |
| Collection Diff. Other waste | Kg. | 10.465.613 | 10.668.197 | 10.694.117 | 7.583.542 | 8.372.122 |
| Total Differentiated | Kg. | 21.745.670 | 25.969.714 | 32.557.936 | 42.228.466 | 53.389.669 |
| % separate collection | % | 18,09% | 23,22% | 31,96% | 43,11% | 53,47% |
| Total undifferentiated MSW | Kg. | 102.401.787 | 91.187.595 | 75.198.443 | 55.723.660 | 46.464.220 |
Given the trend data, it is the hope of Messinaservizi reach 60% by 31.12.2023.
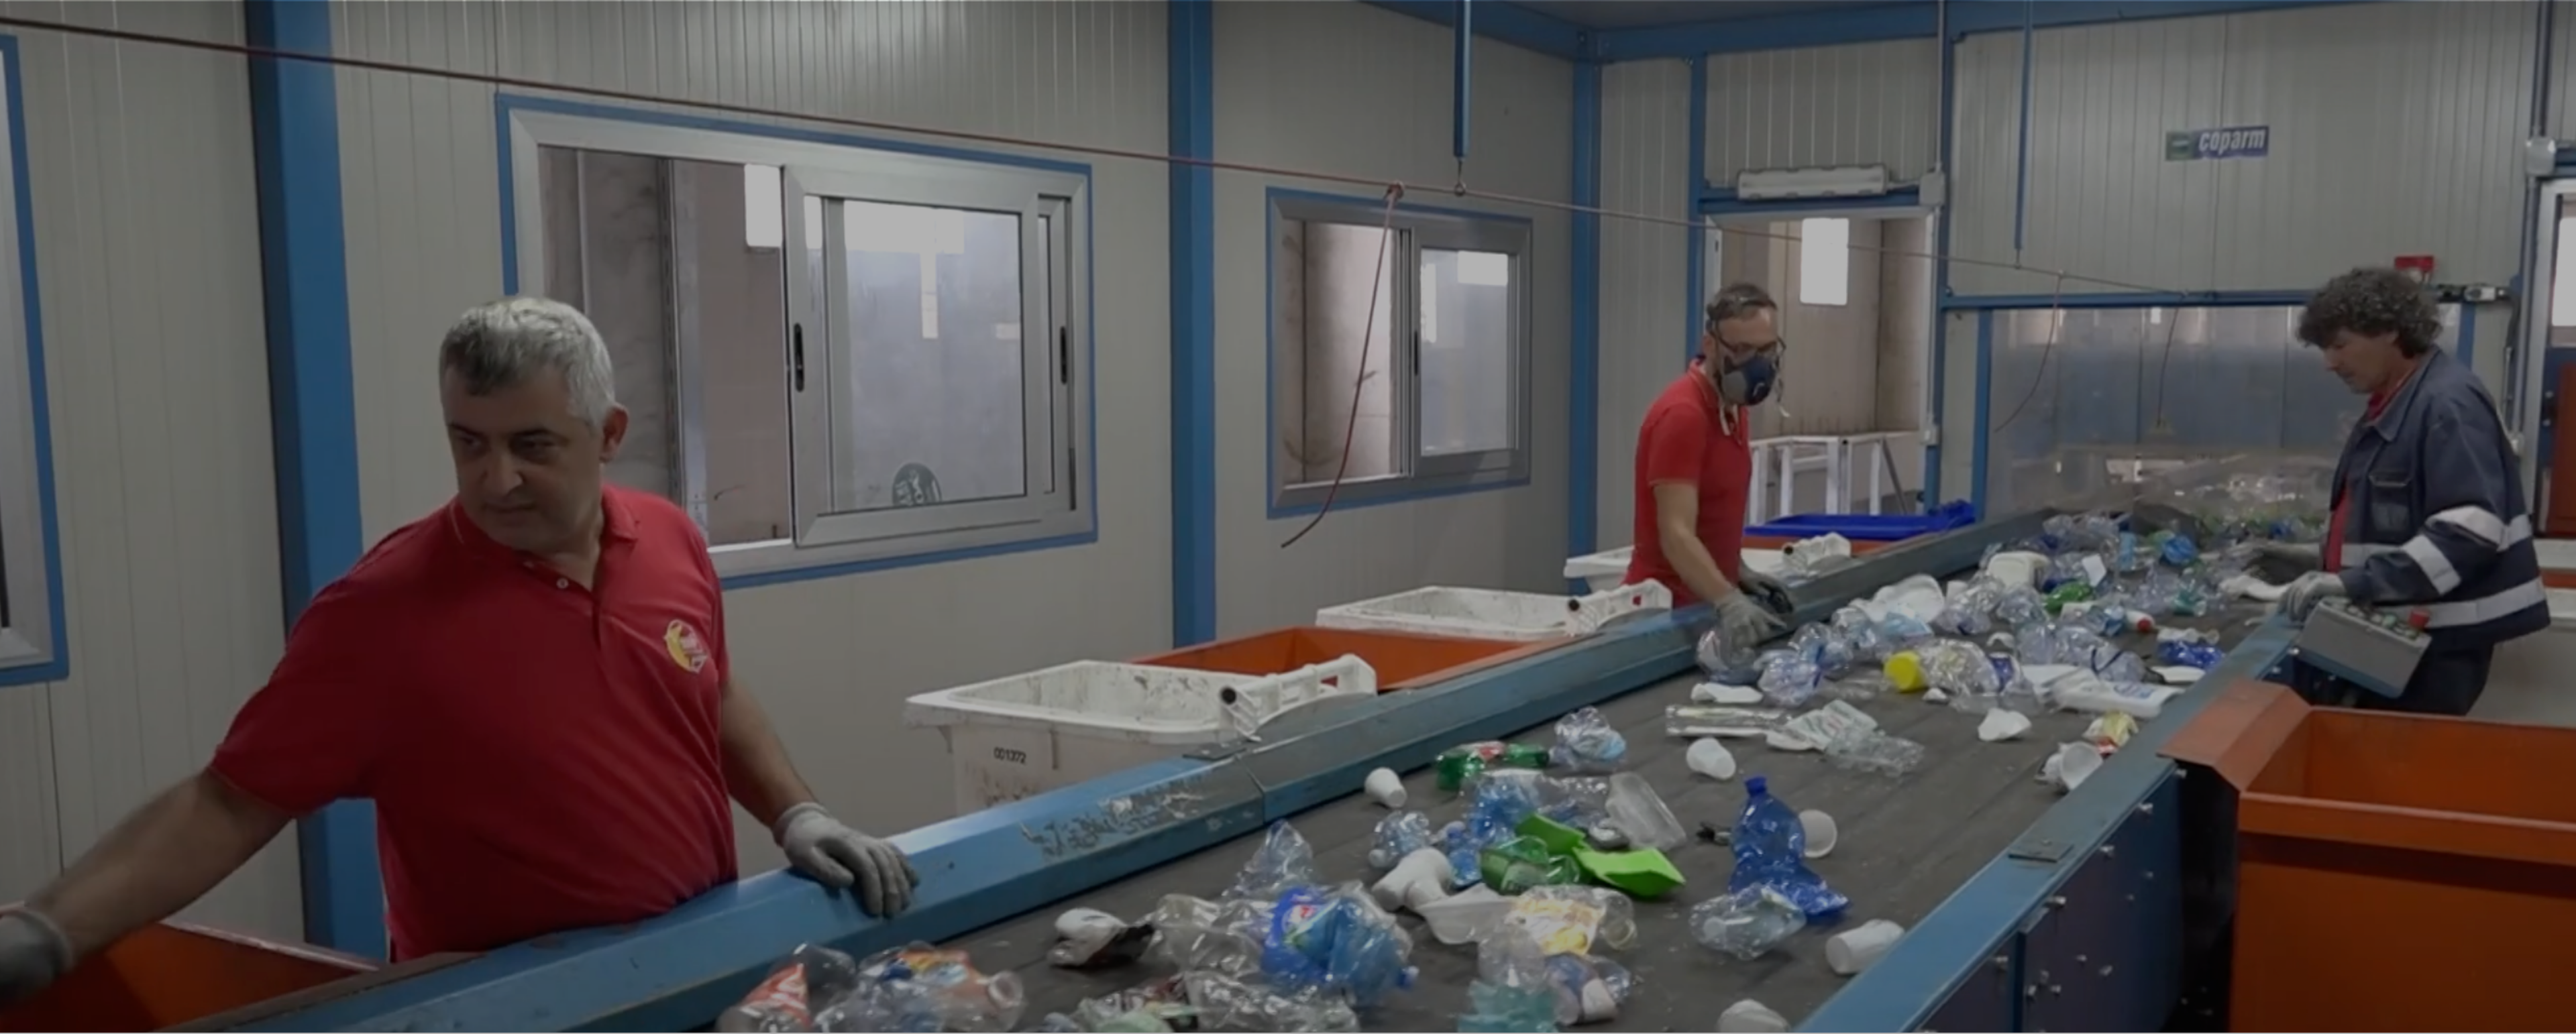
In this regard, appropriate measures were put in place to achieve the objective, including the modification of the collection calendar bringing the collection of paper and glass packaging to a weekly frequency and introducing a new collection and transport method using compacting semi-trailers.
As far as the sweeping services Already during the first half of 2023, services were strengthened with the activation of 9 additional sweeping teams. The reinforcement will be even more evident during the second half of 2023 with the activation of 18 sweeping teams.
| Status: | The level of services is constantly evolving |
|---|---|
| Completion: | Achievement of 60% of RD by 31.12.2023 |
Data Summary Separate Collection 2021
| Grand total Collections (Kg) | 7.562.708,00 |
| Undifferentiated from Collection (Kg) | 5.876.860,00 |
| Total differentiated (Kg) | 1.685.848,00 |
| % Differentiated | 22,29% |
|---|


